Marketing Dashboards & Reporting

A Beautiful Dashboard With Stale Data Is Worse Than No Dashboard at All.

Live, automated marketing dashboards built around the handful of metrics that actually drive decisions — not 30 numbers nobody acts on.

  • Built around decisions, not data dumps
  • Automated, not manually refreshed
  • No long-term lock-in
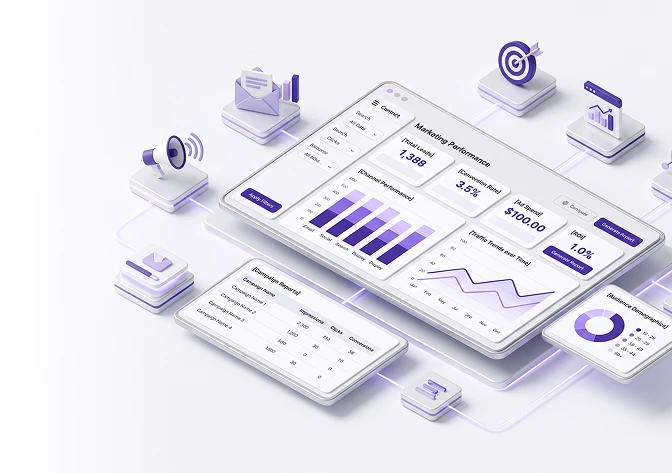
Marketing dashboards and reporting illustration

Context

Why Most Dashboards Quietly Die

A team we know of once built a genuinely beautiful marketing dashboard — comprehensive KPIs, clean layout, refreshed every Monday morning by manually exporting CSVs from six platforms into spreadsheets. It looked great, until a campaign overspent by $12,000 over a weekend, because the dashboard was still showing Thursday’s numbers. Making it update daily would have taken two hours of manual work every day — not worth it, so the team quietly went back to weekly emails.

That’s the real failure mode: a dashboard that isn’t automated isn’t really a dashboard, it’s a delayed, false sense of control. The second most common failure is the opposite problem — a dashboard trying to show 30+ metrics, when usually only a handful actually drive any decision. We build for automation and focus, not just visuals.

Services

Our Marketing Dashboards & Reporting Services

Dashboard Strategy & Stakeholder Mapping
  • Documenting who needs what — leadership, channel managers, and operations typically need genuinely different views
  • Defining the small set of KPIs that actually drive decisions for each audience
  • Reporting frequency matched to how each audience actually uses the data
Dashboard Build & Automation
  • Automated data connections from your ad platforms, CRM, and analytics — no manual CSV exports
  • Live, auto-refreshing dashboards, not static reports that go stale
  • Validation against source platforms before anything gets shared with stakeholders
KPI Reporting
KPI Reporting
  • Paid media dashboards (spend, CPA, ROAS, conversion rate across all channels in one view)
  • Executive and leadership reporting — revenue, CAC, channel ROI
  • Regular reports that end in a clear recommendation, not just a number
Ongoing Dashboard Maintenance
  • Monitoring for broken connections when ad platforms update their APIs
  • Adjusting dashboards as your KPIs and priorities evolve
  • Periodic review to catch dashboard bloat before it creeps back in

How we sequence work

Choosing the Right Tool, Honestly

Different tools fit different situations, and we'll recommend based on your actual needs:

free, connects natively to GA4 and Google Ads, and suits most businesses well, especially smaller marketing teams

Our Process

From first call to ongoing results.

1

Discover & Map

Understanding your stakeholders, what decisions your data actually needs to support, and how often each audience actually needs to see it.

2

Design

Choosing the right tool and defining the focused KPI set for each dashboard.

3

Build & Automate

Connecting data sources with automated refresh — no manual exports.

4

Validate

Checking every number against the original source platform before anything ships.

5

Maintain

Ongoing monitoring so dashboards don't quietly break or drift out of date.

Industries

Industries we work with

Ecommerce & Retail

Ecommerce & Retail

B2B & SaaS

B2B & SaaS

Agencies & Marketing Teams

Agencies & Marketing Teams

Multi-Location & Franchise Businesses

Multi-Location & Franchise Businesses

Professional Services

Professional Services

Healthcare

Healthcare

How we work differently

Automated, not manual

Live data connections, not CSV exports someone has to remember to run.

Focused, not bloated

A handful of decision-driving KPIs per audience, not 30 metrics nobody uses.

Validated against source data

Every number checked before it reaches a stakeholder.

Matched to the right tool

Looker Studio, Power BI, or Tableau, recommended honestly based on your actual scale.

No long-term contracts

We keep earning your account every month.

GET IN TOUCH

Honest Timeline

What to Expect

A focused, single-purpose dashboard (like a paid media view) can typically be built and automated within 1-2 weeks. A fuller reporting system covering multiple stakeholder audiences typically takes 3-5 weeks, depending on the number of data sources and how much stakeholder mapping is needed upfront. Dashboards need ongoing maintenance — we recommend periodic review, since source platforms change their APIs and reporting needs evolve.

Metrics

Results We Focus On

  • Data Freshness (time between real activity and dashboard reflection)
  • Number of Decision-Driving KPIs vs. Total Tracked
  • Stakeholder Adoption & Trust in the Numbers
  • Time Saved vs. Manual Reporting
  • Reporting-to-Action Speed

Pricing

Priced for performance.

Pricing depends on the number of data sources, stakeholder audiences, and whether Looker Studio, Power BI, or Tableau fits best. We'll give you a clear estimate — including an honest tool recommendation — after a free dashboard assessment.

Scoped to your project

Priced to the scope and complexity you actually need

Clear estimate upfront

A fixed-scope estimate after a free consultation

Honest recommendations

We recommend what fits, not the biggest package

Get Your Custom Quote

Is your dashboard actually telling you anything useful?

Get a free dashboard assessment — we'll show you whether your data is stale, your metrics are bloated, or both.

FAQ

Frequently Asked Questions